PolyWorks Inspector™ Tip
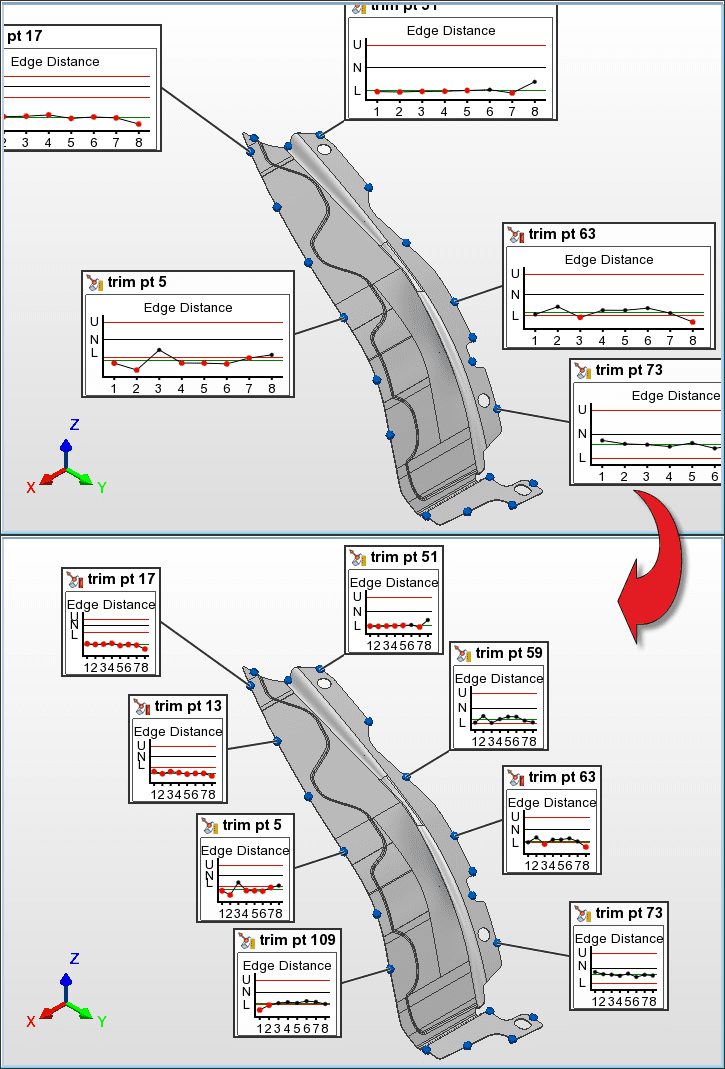
When you inspect a large number of pieces in a project and use trend charts in SPC annotations to view tendencies for many controls, the default width for SPC trend charts can result in a crowded 3D Scene. By resizing the trend charts in SPC annotations, you can easily show more annotations to obtain a better appreciation of the part tendencies.
Step by step: To resize trend charts in SPC annotations:
- Choose the Tools > Statistical Process Control > Objects Controls menu item to open the Object Control SPC tool.
- In the Options section of the Object Control SPC window, make sure the Annotations option is set to SPC.
- Make the desired measurement objects and their annotations visible.
- Edit the display of an SPC annotation to include trend charts:
- In the 3D Scene, hover the mouse pointer over the annotation for which you want to display trend charts.
- On the mini toolbar that is displayed, click the Edit Annotation button. The Edit Annotation window is displayed for the object.
- From the window’s top menu, click the Set Contents using Template menu button and click the Trend charts only annotation template in the list that is displayed. A trend chart for each active control of the object is displayed in the object’s annotation.
- Click the OK button to apply the changes and dismiss the editor.
- Specify a height and width for trend charts in SPC annotations:
- Choose the Tools > Options menu item to display the PolyWorks|Inspector Options dialog box.
- Navigate to the Display > Annotations > Formatting
- In the SPC trend charts section, specify values for the Width (pixels) and Height (pixels)
- Click the OK button to apply the values and close the PolyWorks|Inspector Options dialog box. The SPC annotations containing trend charts are immediately resized.
NOTE: When columns are displayed in SPC annotations along with trend charts, the width of the trend charts can never be less than the total width of all of the displayed columns.


